Researcher degrees of freedom can lead to a multiple comparisons problem, even in settings where researchers perform only a single analysis on their data. The problem is there can be a large number of potential comparisons when the details of data analysis are highly contingent on data, without the researcher having to perform any conscious procedure of fishing or examining multiple p-values.
A researcher has to make a large number of decisions during their research. She may explore different configurations throughout the course of her research, and report on the final results. Some decisions are mentioned or justified, but others are simply stated. It may not be intentional or feel like p-hacking, but it has similar effects.
I think this affect is contributing to the replication crisis in science. Ideally, there would be a place for researchers to pre-register their original plans and methodology.
I’ve seen the affect myself while trying to design trading algorithms that backtest well. I would have some rule (e.g. buy when stock price drops below N days moving average) and I would solve for the meta parameters that did well. Obviously, when I test the strategy on an out of sample set, the pattern doesn’t hold. There was no feasible story to why my particular N is special.
Ever since then, I made a habit trying to identify the number of forking path’s in research papers. The more forks, the more skeptical I am of the results.
We document that a portfolio that mimics the purchases of U.S. Senators beats the market by 85 basis points per month, while a portfolio that mimics the sales of Senators lags the market by 12 basis points per month.
I’m not totally unbiased here since I did my own research on Senator stock picks during early 2020. I found that Senators made decisions typical of investors at that time (mostly market outflows). Those that sold (outflows were heavier than inflows) did well as stocks dropped significantly. Those that bought, lost money. But I found no compelling evidence of above market returns, even for Kelly Loeffler.
Of course, I had to make decisions, but I only made one set and stuck with them. I don’t have a horse in this race, but I encourage you to use my data to run your own analysis. I used simple intuitive measures. It was an implementation of what you would answer if you had 30 minutes to come up with a plan on a cocktail napkin.
Back to the research. Let’s break it down to see if we can spot the forking paths:
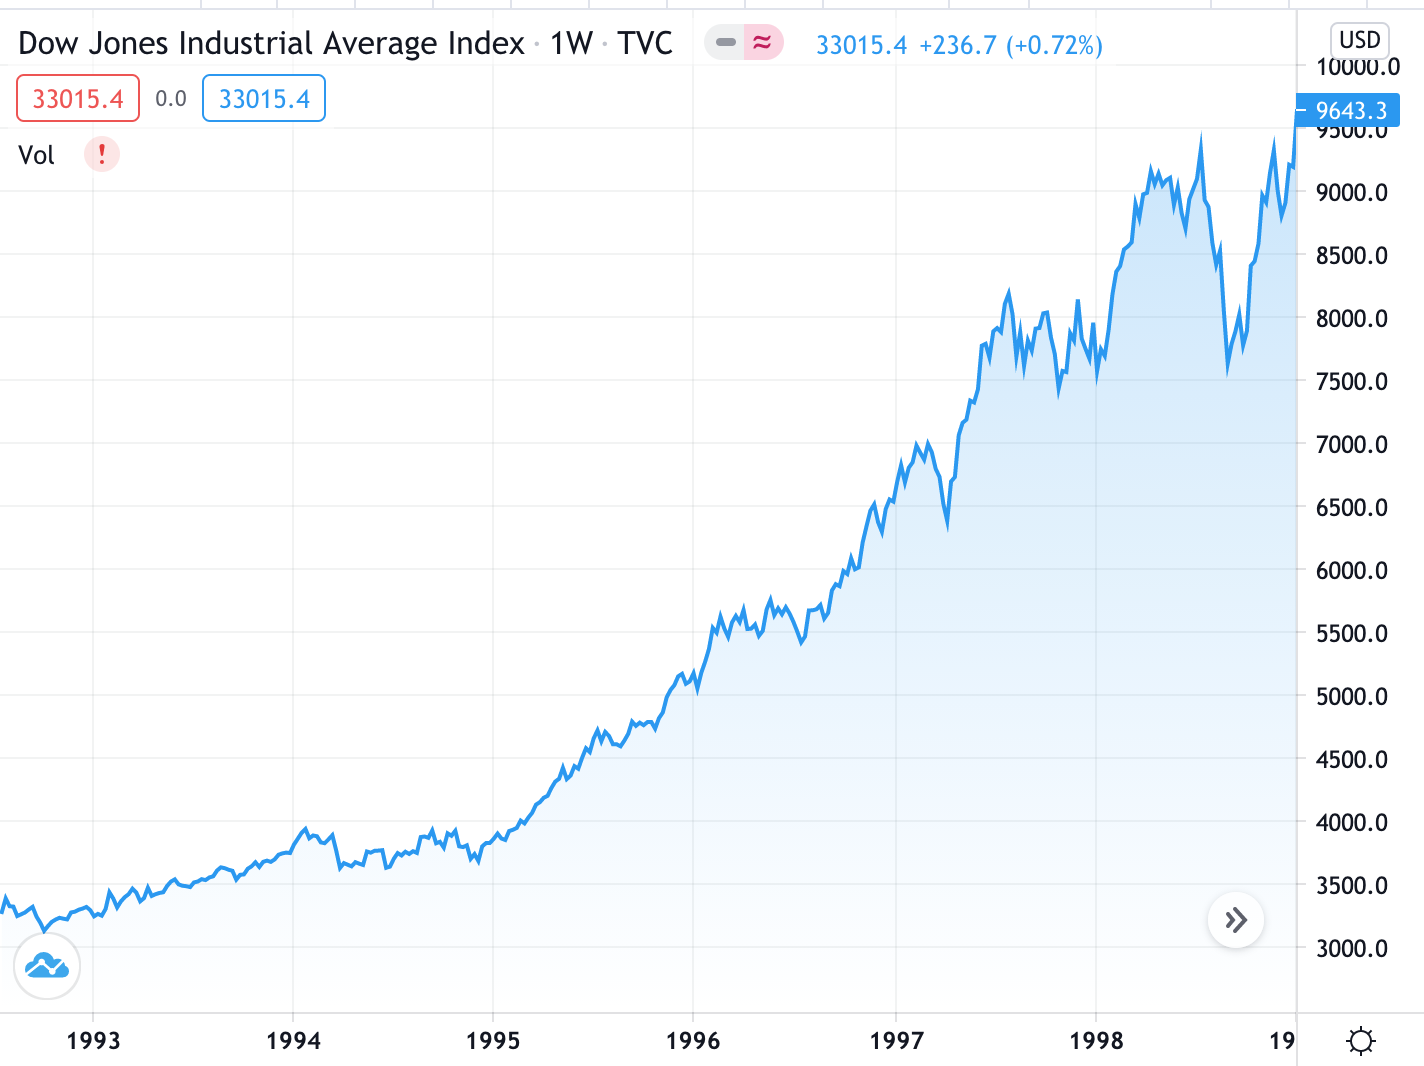
We test for abnormal returns from the common stock investments of members of the U.S. Senate during the period 1993–1998
This paper was published in 2004. Why did they pick 1993 - 1998? It may have been to account for a single 6 year term.
House members have the same reporting requirements. Why did researchers only consider Senators?
This was the period used:
Let’s look at the universe:
Initially, we begin with 6,052 transactions. Before analysis we apply several screens to the data. Only U.S. common stocks are included in the study. These screens eliminate, among other things, all preferred stock, ADRs, REITs, foreign stocks, and mutual funds. We also eliminate all initial public offerings (IPOs) from the sample. In total, 360 observations are eliminated for the reasons given above. Among the surviving transactions, approximately 59% of the stocks are listed on the NYSE, 40% are traded on the NASDAQ, and about 1% are listed on the ASE.
So far I count:
Filter non US common stocks
Eliminate among other things, all preferred stock, ADRs, REITs, foreign stocks, and mutual funds
Eliminate IPOs
They don’t give a reason for the first 2, but they do provide a reason for excluding IPOs:
IPOs were excluded because of the possibility that Senators were allocated these shares during the IPO process. Loughran and Ritter (1995) have shown that IPOs typically earn a high return on the first trading day but under-perform the market thereafter. Thus, though they may prove to be poor long-term investments, these losses are more than likely compensated for by the large first-day returns earned by many IPOs.
Did you get all that? IPOs may have a pop but are bad long term investments, so best to exclude them from our analysis.
Let’s keep going:
As indicated previously, Senators report transaction amounts only within broad ranges.
Ranges are as follows: $1,001 to $15,000 $15,001 to $50,000 $50,001 to $100,000 $100,001 to $250,000 $250,001 to $500,000 $500,001 to $1,000,000 over $1,000,000
As before, we again estimate the value of their trades using the midpoint of the range reported by the Senators for all transactions less than $250,000. For all transactions above $250,000, we assume a transaction size equal to $250,000.
Why do they use the floor of $250,000? Why didn’t they just take the midpoint as they did with every other tier?
Why didn’t they use a $1M floor for trades over $1M?
And on to the comparison portfolios:
We obtain daily portfolio return series for four calendar-time portfolios: an equally-weighted portfolio of the buy transactions, a trade-size-weighted portfolio of the buy transactions, an equally-weighted portfolio of the sell transactions, and a trade-size-weighted portfolio of the sell transactions
They look at the buy trades independent of the sell trades, which is odd. It seems like an unnecessary complexity. If the buys outperformed, but sells were a lot larger, then its not a good strategy on the whole.
And that’s all before we even get to the comparison portfolio and how the performance was measured. What’s the right control portfolio?
The regression parameters for the Fama-French model are i, i, sp, and hp. The three factors i, sp, and hp are zero-investment portfolios representing the excess return of the market (Rm Rf), the difference between a portfolio of small stocks and a portfolio of big stocks (SMB), and the difference between a portfolio of high book-to-market stocks and a portfolio of low book-to-market stocks (HML), respectively.
Is this the right portfolio? How would a buy and hold stack up? This hardly tells you how someone did relative to their peers. Note the forking paths when defining terms big, small, high and low.
Financial analysis is particularly tricky. There’s no natural control group. And performance measures require a lot of math and background knowledge to understand and evaluate.
But what makes me most skeptical is the low stakes involved. In 1998, the number of buy trades was as follows:
I’m sorry but these are some Robinhood numbers, even from mid-1990s standards. Imagine making it all the way to the highest branch of the US government, to make an extra 85bps on your sub-15k buys while only sacrificing 15bp on your sells! The story doesn’t make sense, but at least you have a cool headline.